INFO
-
Purpose
The application enables a different evaluation of the images obtained under standard conditions of all kinds of materials with hollow structures, such as trabecular, spongy and porous. This application can be useful in obtaining information about the depth, size and characteristics of hollow areas. The application was developed to contribute to the depth analysis of trabeculae, soft tissues and pathological cavities in anatomical structures in two-dimensional dental radiographs. In addition to oral and maxillofacial radiology, it can also be used in the fields of geology, archaeology, engineering, botanic and zoology under appropriate conditions. It can help detect abnormal samples and desicion-making for obtain detailed images (3D radiography, etc.) by examining standardized images of standard structures. Since the application is created on the principle of converting gray values into numerical data based on the behavior of x-rays as they pass through hard organic materials such as bones and teeth, the depth analyses to be created on images other than radiographic images (color images or images that do not contain radiation such as USG, etc.) may vary.
-
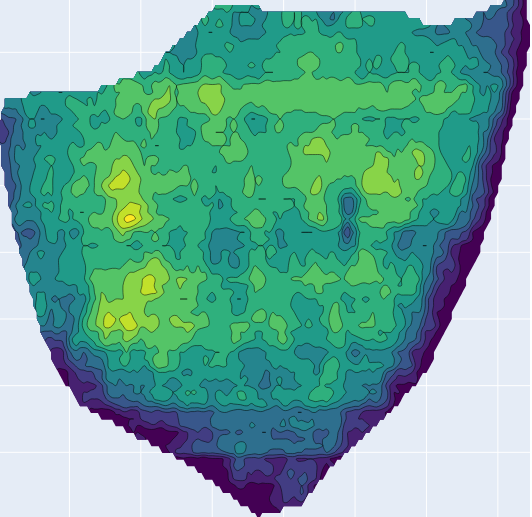
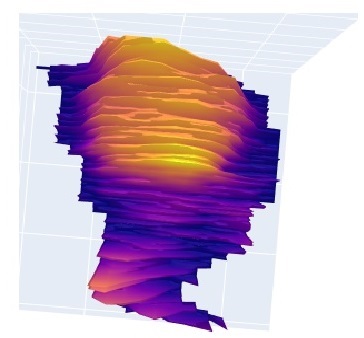
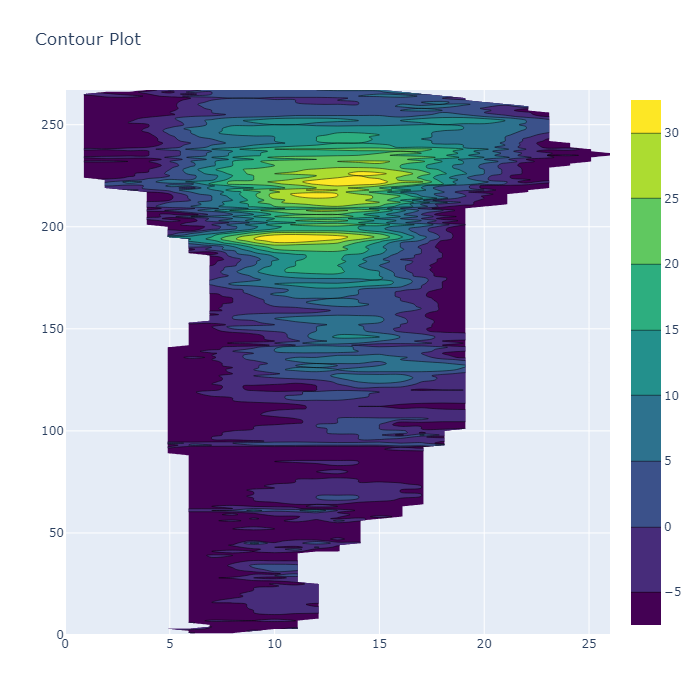
Depth Analysis of Trabecular Structures mode
The region of interest (ROI) on which depth analysis is desired is loaded into the application with this command. The information on the screen that appears is general numerical information. The number of pixels indicates the amount of pixels in the loaded ROI. Pixel averaging provides numerical average depth information in the image analyzed by the application. Edge density provides information about the amount of contour for the loaded ROI. Images with an edge density below 0.2 represent plain images or images with very little detail. Examples of ROI values of 0.3 and above are complex images with lots of detail. Values between 0.2 and 0.3 represent image types that fall between simple and complex images. The screen that appears is closed with the “ok” tab, a new screen will appear and you will be asked to write “2d” or “3d”. If you write “2d” and press enter, a depth analysis image of the ROI you uploaded will be created. You can download this image. If you write “3d” and press enter, a simple three-dimensional model of the ROI will be presented to you. You can examine the depth analysis by angling it as you wish.
-
Power DATS mode
If there is an increase in hard tissue thickness around the hollow structures in the ROI where depth analysis is desired, preventing the appearance of this hollow structure, this command was created to ensure that the hollow structure is displayed more clearly. In images where the trabecular structure is not clearly visible, the use of Power DATS will reveal the areas where the trabecular structures are located more clearly. When both DATS and Power DATS analysis are performed for the same ROI, the gap structures that become apparent can be distinguished more clearly by comparing the two analysis images. As in the DATS command sequence, after the ROI is loaded, a screen will appear again. Unlike DATS, this screen only contains pixel count and depth average information. After closing the “ok” tab, the Power DATS analysis of the ROI can be examined again with the “2d” and “3d” options.
-
CROP tool
Under this tab, images can be loaded into the program, the relevant area within the image can be determined and ROI selection can be made. The ROI can be limited by making repeated selections with the left mouse button, when the limitation is completed, the ROI can be created by pressing the right button once, and this ROI can be uploaded. Various features to be used in the image from which ROI will be selected are located at the bottom of this screen. Since the program works more efficiently on rows and columns, it may be useful to bring the region from which the ROI will be taken to the appropriate position with right-left rotation features.
-
Fees
Free Software